Routing Status: In Progress (4 iterations)

Routing metrics:
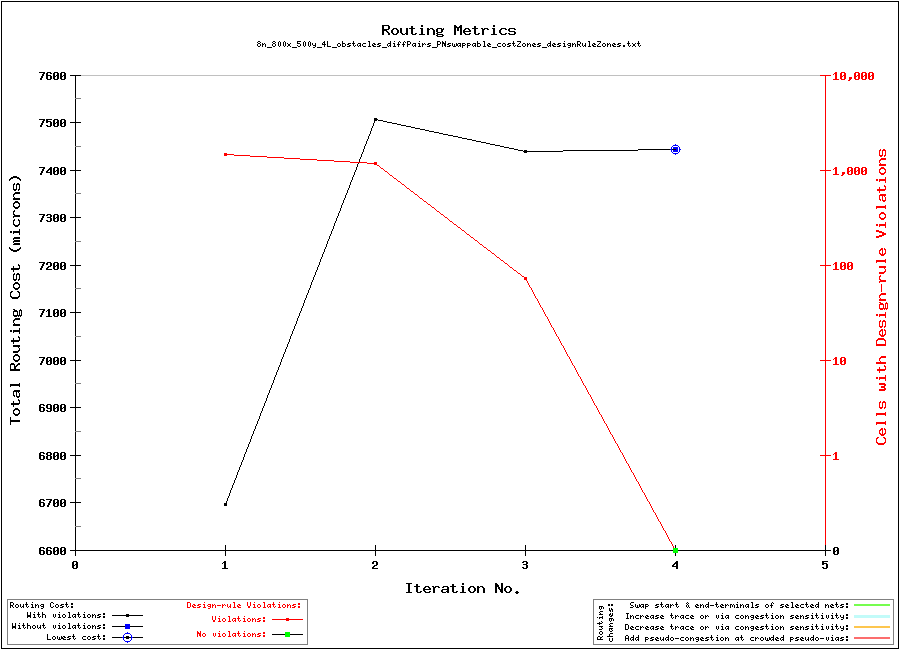
Graph of routing metrics
Aggregate routing cost, including lateral traces and vertical vias, and accounting for user-defined cost-zones. The vertical axis on the right shows the number of square cells involved with design-rule violations. Each cell is 1.00 by 1.00 microns in size, as defined by the 'grid_resolution' parameter in the input file.
 
Pre-routing configuration
 
Animated routing evolution
Layer Color
M1  
V12  
M2  
V23  
M3  
V34  
M4  
Pre-routing configuration


Metrics by Iteration:
Iteration Nets with
Violations
Cells with
Violations
Aggregate Path
Length (mm)
Via
Count
Explored
Cells
Elapsed
Time (seconds)
Cumulative
Time (seconds)
 4 
Lowest cost
0 / 8
Fewest nets
 0 cells
(#1 / 51)
6.1219 mm
Shortest without
violations
24 vias 408,056 5 s 26 s
 3  2 / 8  72 cells 6.1180 mm 24 vias 416,677 6 s 21 s
 2  8 / 8  1,166 cells 6.1167 mm 24 vias 450,512 6 s 15 s
 1  8 / 8  1,473 cells 5.8068 mm 24 vias 502,931 5 s 9 s
  Other Animations:
Routing
Layer Pairs
All
Iterations
M1
&
M2
LINK
M2
&
M3
LINK
M3
&
M4
LINK


Pre-routing Information:   Key parameters:
  • grid_resolution: 1.00 um
  • maxIterations: 200
  • violationFreeThreshold: 20
  • DRC_free_threshold: 51
  • baseVertCostMicrons: 37.0 um
  • baseVertCostCells: 37 cells
  • baseVertCost: 397,284,474,880
  • preEvaporationIterations: 2
  • runsPerPngMap: 1
  • baseCellCost: 10,737,418,240
  • baseDiagCost: 15,185,002,499
  • baseKnightCost: 24,009,597,087

Updated at 10:12 on 10-12-2024 from Acorn version 'v2024-10-11-1-g82b7-dirty' using 8 threads.